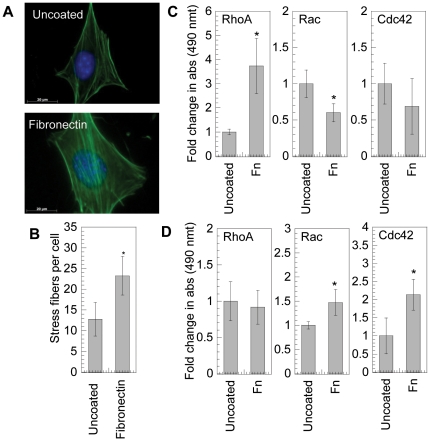
Figure 1. RhoGTPase activation on fibronectin.
(A) mMSCs were plated on uncoated or fibronectin (40 µg/mL) coated surfaces for 16 hours and cell morphology was studied by staining cells for actin using Alexa488 conjugated phalloidin (green), and for DNA using Hoechst 33258 dye (blue). Images were taken with a Zeiss AxioObserver Z1 inverted microscope at 100× magnification. (B) Stress fiber quantification. (C and D) Active RhoGTPase quantification was performed using GLISA specific for RhoA, Rac1,2,3 and Cdc42. Cells were culture in PDMS sheets and allowed to attach and spread before exposing them to protein modified plastic for 20 minutes or 1 hour. The average of three samples was plotted. The level of active RhoGTPase in samples exposed to fibronectin was compared with untreated sample using the unpaired t-test (two tail p value). The symbols * represents a significant change to the level of p<0.05. The error bars represent the standard deviation in all plots.

