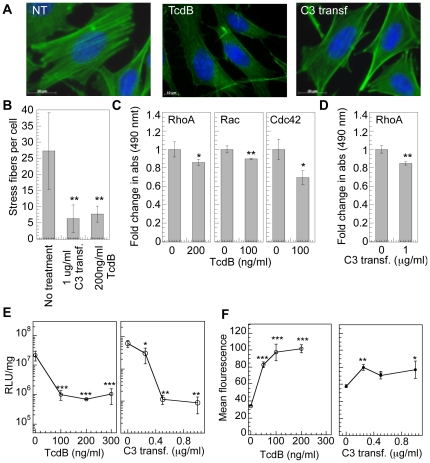
Figure 2. RhoGTPase inhibition using TcdB and C3 transferase decreases transgene expression.
mMSCs were plated on fibronectin (40 µg/mL) coated tissue culture plastic for 16 hours prior to being treated with 0–300 ng/ml TcdB for 4 hours in serum free media, or 0–1 µg/ml C3 transferase for 4 hours. (A) Cell morphology was studied immediately after treatment with inhibitor, by staining cells for actin using Alexa488 (green) conjugated phalloidin, and for DNA using Hoechst 33258 dye (blue). Images were taken with a Zeiss AxioObserver Z1 inverted microscope at 100× magnification. (B) Stress fiber quantification. Statistical analysis was done using a one-way Anova followed by the Dunnett Multiple Comparison test. The Anova p value was 0.0052. The symbol ** represents a significant change in stress fibers with respect to untreated cells to the level of p<0.01. (C) Active RhoGTPase quantification was performed using GLISA specific for RhoA, Rac1,2,3 and Cdc42. (D) Active RhoA quantification was performed using GLISA specific for RhoA. Statistical analysis was done using the unpaired t-test (two tail p value) where active RhoGTPase level in treated cells was compared with untreated cells. The symbols * and ** represents a significant change to the level of p<0.05 and p<0.01, respectively. (E) Cells were transfected immediately post treatment and transgene expression was analyzed at 48 hours using luciferase assay and normalized with total protein quantified using Peirce BCA assay. (F) Cells were transfected immediately post treatment with YOYO-1 labeled polyplexes and after 2 hours cells were collected with trypsin and polyplex internalization analyzed by flow cytometry. A total of 7000 events were analyzed per sample. Experiments were performed in triplicate and the average plotted with the error bars representing the standard deviation. Fold increase in transgene expression and internalization was calculated with respect to the untreated control. Statistical analysis for gene transfer and internalization was done using a one-way Anova followed by the Tukey-Kramer Multiple Comparison test, which compares all columns. The Anova p values for transgene expression were 0.004 and 0.0052 for TcdB and C3 transferase, respectively and the Anova p values for internalization were <0.0001 and 0.0067 for TcdB and C3 transferase, respectively. The symbol ***, ** and * represents a significant change in gene expression or internalization with respect to sample not treated with inhibitor to the level of p<0.001, p<0.01 and p<0.05, respectively.

