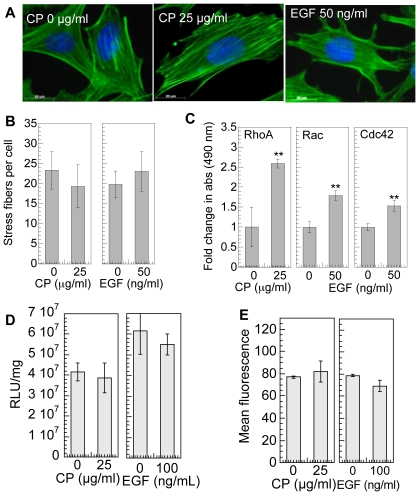
Figure 4. Effect of RhoGTPase activation using calpeptin (CP) and epidermal growth factor (EGF) on gene transfer.
mMSCs cells were cultured for 8 hours on fibronectin wells, followed by overnight serum starvation and then treated with 0–100 µg/ml CP for 10 minutes or 0–100 ng/ml EGF for 2 minutes in serum free media. (A) After treatment, the changes in cell morphology were visualized through lexa488 conjugated phalloidin (green) and for DNA using Hoechst 33258 dye (blue) staining. Images were taken with a Zeiss AxioObserver Z1 inverted microscope at 100× magnification. (B) Stress fiber quantification. (C) Active RhoGTPase quantification after treatment was performed using GLISA specific for RhoA, Rac1,2,3 and Cdc42. (D) Transfection was performed immediately post treatment in serum free media. 4 hours post transfection media was replaced with complete media. The transgene expression was analyzed 48 hours post transfection using luciferase assay and normalized with total protein analyzed using Peirce BCA assay. (E) Internalization was analyzed 2 hours post transfection using flow cytometry of YOYO-1 labeled polyplexes. A total of 7000 events were analyzed per sample. Statistical analysis for the level of active RhoGTPase, transgene expression and internalization, was done using the unpaired t-test (two tail p value) where treated sample was compared with untreated sample. The symbols ** and *** represents a significant change to the level of p<0.01 and p<0.001, respectively.

