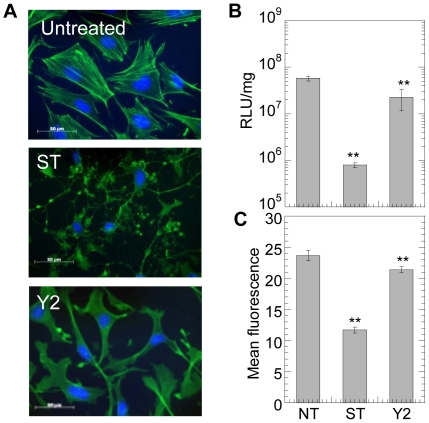
Figure 7. PKC and ROCK inhibition, inhibit gene transfer in cells plated on fibronectin.
mMSCs were cultured for 16 hours on fibronectin coated plates prior to treatment with 10 µM Y27632 (Y2) or 100 nM Staurosporine (ST) for 2 hours to inhibit ROCK and PKC, respectively. (A) Changes in mMSC cell morphology were visualized through staining for actin using Alexa488 conjugated phalloidin and for DNA using Hoechst 33258 dye. Images were taken with a Zeiss AxioObserver Z1 inverted microscope at 40× magnification. Immediately after treatment with inhibitor, the medium was replaced and bolus transfection was done. (B) Transgene expression was analyzed 48 hours post transfection using luciferase assay and normalized with total protein analyzed using Peirce BCA assay. Internalization was assessed 2 hours post transfection using flow cytometry and YOYO-1 labeled polyplexes (C). A total of 7000 events were analyzed per sample. Statistical analysis was done using a one-way Anova followed by the Dunnett Multiple Comparison test. The Anova p value was 0.0003 and <0.0001 for transgene expression and internalization, respectively. The symbols ** represents a significant change to the level of p<0.01.

