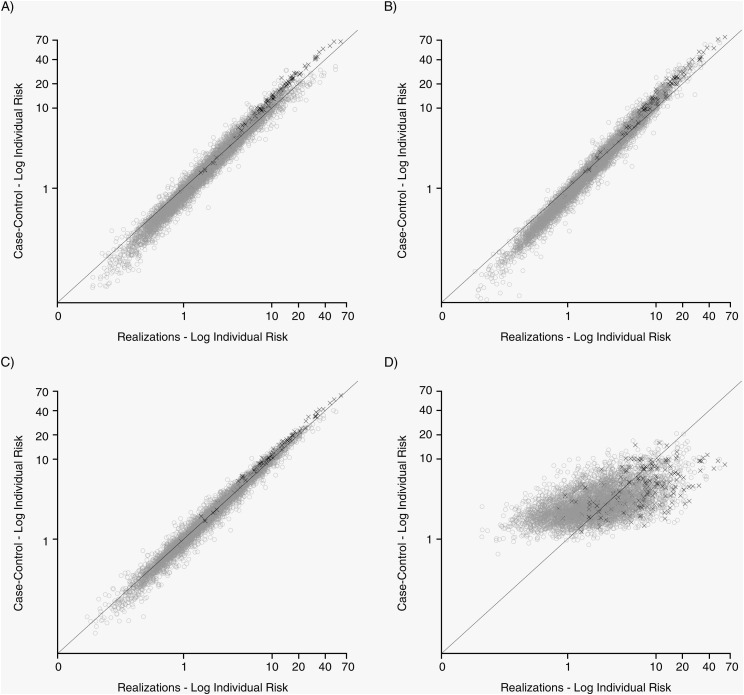
Figure 1.
Individual risk (plotted on the logarithmic scale) from sampling designs compared with the realizations (“gold standard”) for simulated biomarker 1 (BIO1) and a 1:1 sampling ratio, TwinGene, 2004–2009. Values on the bisector indicate perfect agreement between individual risk calculated in the sampling design and in the realization. Cases are represented by a black “X” and controls by gray hollow circles. A, realizations versus unstratified case-cohort design; B, realization versus unmatched nested case-control design; C, realizations versus stratified case-cohort design; D, realizations versus matched nested case-control study design.

