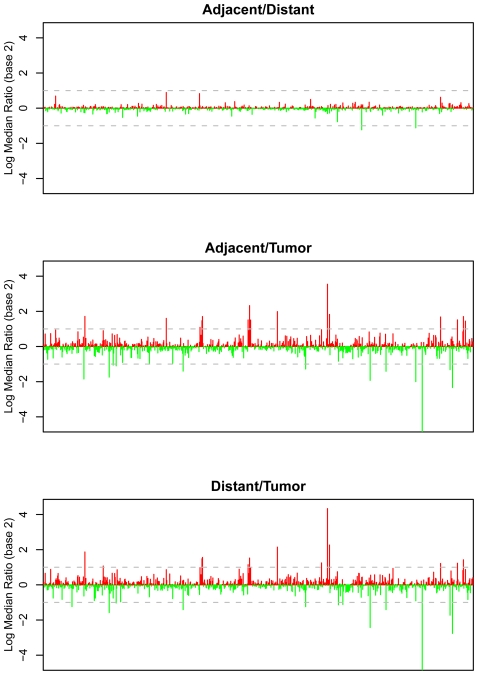
Figure 1. Relative changes in protein expression for 820 proteins from eight NSCLC resection samples.
Signal differences between adjacent and distant tissue (panel A), tumor and adjacent tissue (panel B) and tumor and distant tissue (panel C) are expressed as log2 median ratios. The dotted line represents two-fold change (log2 = 1).

