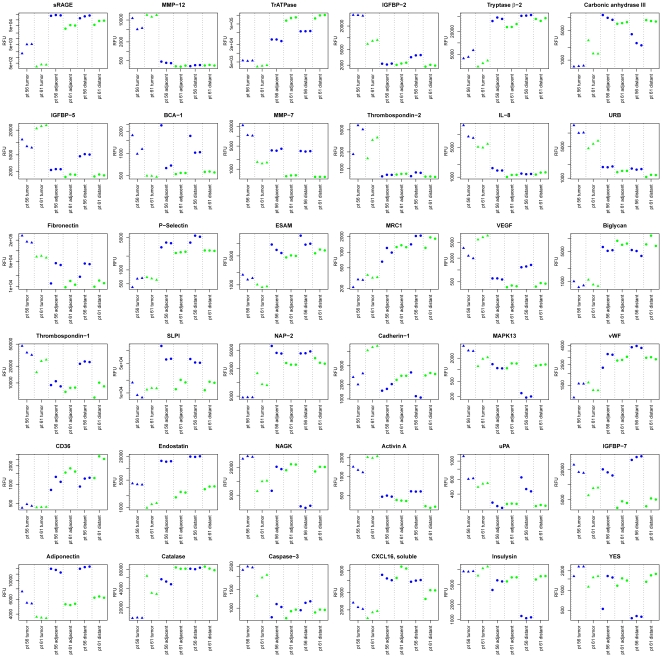
Figure 5. Plots of triplicate samples for the 36 analytes with the largest mean fold-change in protein expression between tumor and non-tumor tissue samples (Table 2).
The tumor, adjacent non-tumor, and distant non-tumor tissue resections were sampled, extracted, and analyzed with the SOMAscan proteomics assay in triplicate for two individuals (patients 56 and 61) in the study. The samples are colored by individual and the tumor samples are highlighted as triangles. The y-axis is on a log scale.

