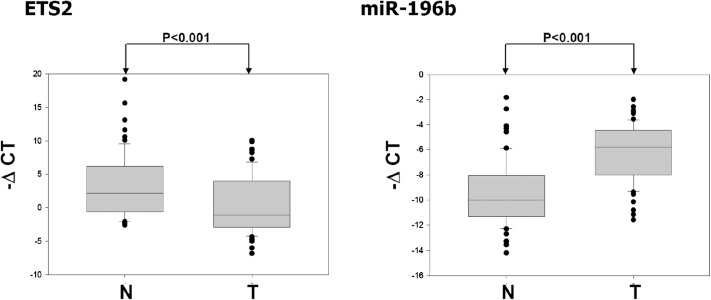
Fig. 3.
Expression profiles of ETS2 and miR-196b in gastric tumors. Examination of ETS2 mRNA and miR-196b expression in 63 pairs of gastric cancer samples. The results were normalized against the expression level of glyceraldehyde 3-phosphate dehydrogenase mRNA or U6 RNA in each sample, respectively. The box plot shows the data distribution across the group classification and presents the 75th and 25th percentile (upper and lower quartile) with the median value in between. N indicates the average expression level of all 63 normal adjacent tissues; T indicates the average expression level of all 63 gastric tumor tissues. There was a significant difference between the level of ETS2 mRNA and miR-196b when tumors were compared with the adjacent tissue.

