Fig. 4.
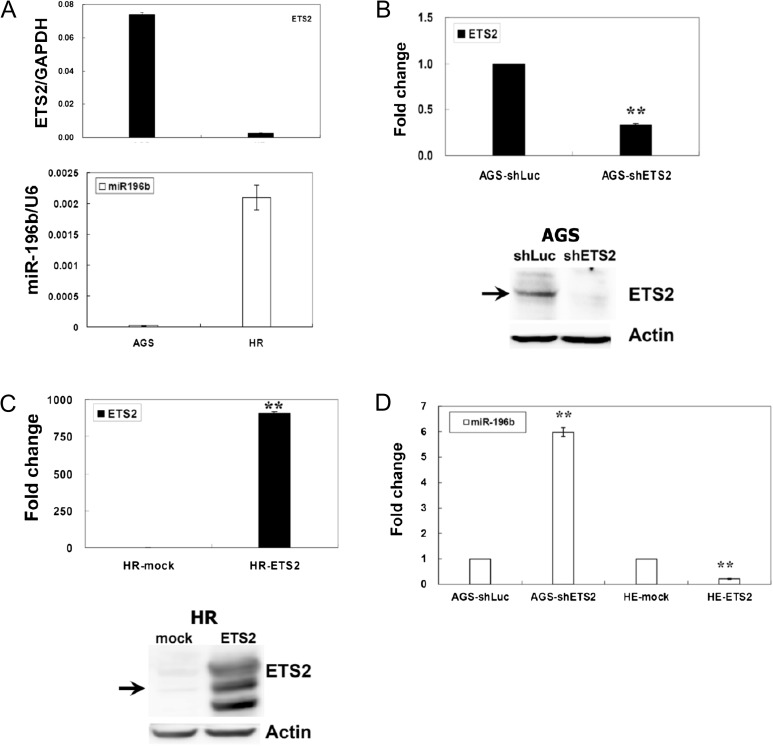
Identification of ETS2 repressed miR-196b expression in gastric cell lines. (A) Expression profiles of ETS2 and miR-196b in gastric cancer cell lines. Expression levels of ETS2 mRNA and miR-196b in gastric cancer cell lines were detected using RT–qPCR by the SYBR Green I protocol. (B) Suppression of ETS2 in AGS cells was achieved with shETS2 lentiviral infection. A control shLuc lentivirus was used as a negative control. The effect of ETS2 knockdown was verified in the AGS–shETS2 cells by RT–qPCR and western blotting using an anti-ETS2 antibody. shETS2 knockdown reduced the level of endogenous ETS2 mRNA and protein by ≥60%. The expression of ETS2 and miR-196b were detected using RT–qPCR. shLuc was used as the negative control. (C) Overexpression of ETS2 in HR cells was achieved with Flag-ETS2 plasmids transfection. Overexpression was verified in the HR–ETS2 cells by RT–qPCR and western blotting using an anti-ETS2 antibody. HR cells transfected with Flag-ETS2 plasmids increased ETS2 expression in both mRNA and protein levels. Expression of ETS2 and miR-196b were detected using RT–qPCR. Mock transfections were used as negative controls. (D) After shETS2 knockdown of endogenous ETS2, expression of miR-196b in AGS cells was upregulated. After transfected with the Flag-ETS2 plasmid, the expression of miR-196b in HR cells was downregulated. In RT–qPCR, all values of ETS2 or miR-196b were normalized against glyceraldehyde 3-phosphate dehydrogenase (GAPDH) mRNA or U6 RNA, respectively. For western blotting, total proteins (30 μg) were loaded and total actin was used as the internal control. The standard deviation is indicated. *P < 0.05, **P < 0.01.

