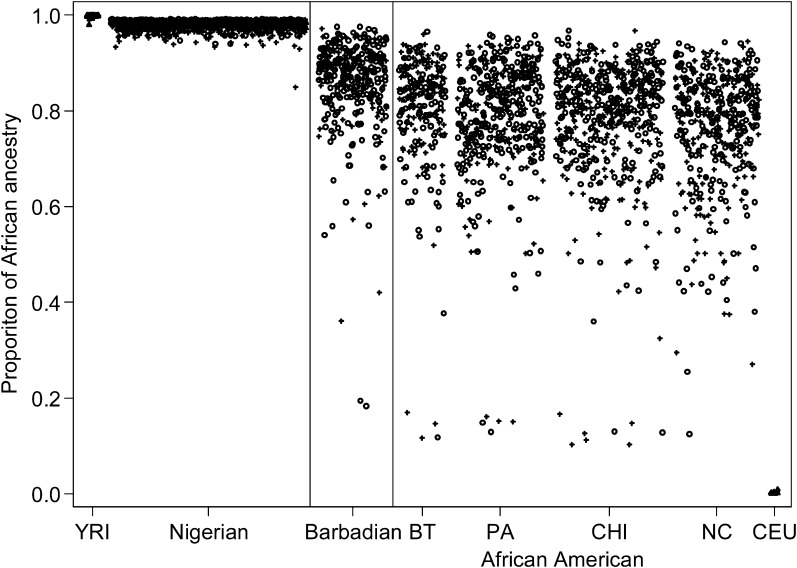
Fig. 1.
Distribution of estimate of African ancestry proportion by study populations and case/control status. African Americans were recruited at four sites (BT, Baltimore; PA, Pennsylvania; CHI, Chicago; NC, Northern California). Cases were presented in plus symbols and controls were presented in open circles. Two HapMap populations were also plotted as benchmarks (Yoruba in Ibadan, Nigeria, Yoruba in Ibadan, Nigeria; CEU (Utah residents with Northern and Western European ancestry from the CEPH collection), Utah residents with Northern and Western European ancestry from the Centre d'Etude du Polymorphisme Humain collection).

