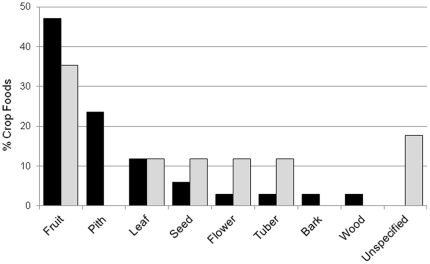
Figure 3. Profile of cultivated plant parts recorded eaten by chimpanzees.
The number of food items in each part category is shown as a percentage of all confirmed (black bars, n = 34) and unconfirmed (grey bars, n = 17) cultivated food items. The proportion of confirmed and unconfirmed crop foods per category is uncorrelated (Spearman's rank correlation: rs = 0.074, n = 9, p = 0.85).

