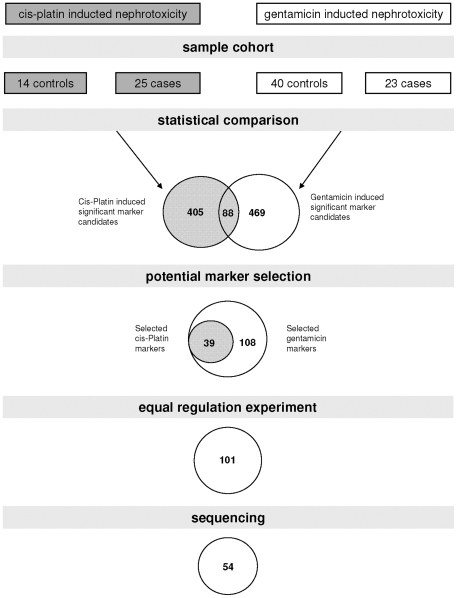
Figure 1. Study design and rationale for biomarker selection.
Depicted is the size of the sample cohorts used in the biomarker definition step and the number of selected peptides after statistical comparison of the respective treated and control groups. Numbers of peptides identified in both cis-platin and genatmicin treated rats as markers are denominated in the intersection of the diagrams. The significant marker candidates were visually inspected and only those candidates were selected that showed a clear response to gentamicin. In the next step the direction of regulation was controlled for the markers identified in both studies and selected were only those demonstrating similar (up or down) regulation with both cis-platin and gentamicin. In the last step the number of markers for which the amino acid sequence could be resolved is listed.

