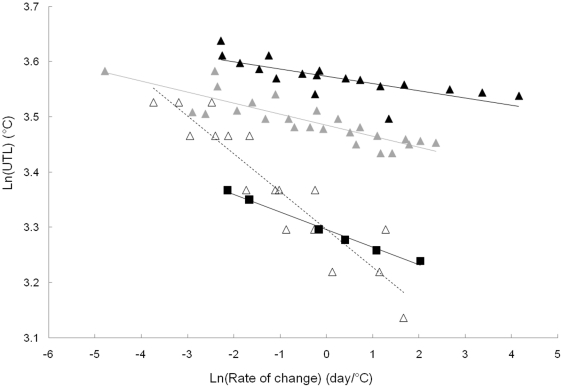
Figure 1. Log-log relationship for upper temperature limit (UTL) versus rate of temperature change.
Only marine subtidal species from experiments done in summer are used in this figure. Data for the dynamic method were combined with those from the static method after transformation using the Kilgour and McCauley [17] model. Black triangles: species from Northern Hemisphere Warm Temperate environments (NHWTSW) in the South of France and the West coast of the United States of America in very Shallow Water (<2 m); grey triangles: species from Northern Hemisphere Warm Temperate environments (NHWT) in the South of France and the West coast of the United States of America in deeper water (>2 m); open triangles: species from a Southern Hemisphere Warm Temperate environment (SHWT) on the Peru coast; and black squares: species from a Cold Temperate environment (CT) in Scotland. For each ecosystem, a linear regression is fitted. Black triangles: y = −0.01×+3.6 R2 = 0.57, grey triangles: y = −0.02×+3.5 R2 = 0.75, open triangles: y = −0.07×+3.3 R2 = 0.86, black squares: y = −0.03×+3.3 R2 = 0.99.

