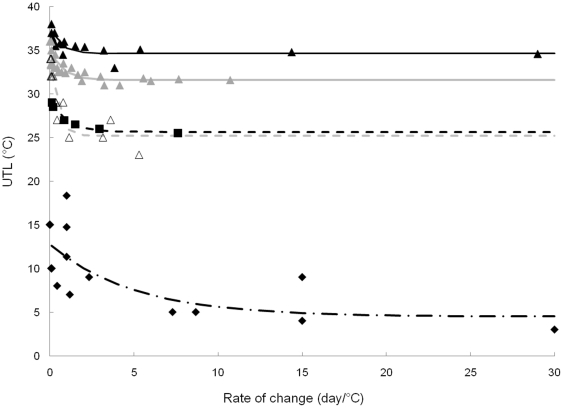
Figure 4. Correlation between upper temperature limit (UTL) and rate of temperature change.
Black triangles: Northern Hemisphere Warm Temperate environments in Shallow Water (<2 m; NHWTSW), grey triangles: Northern Hemisphere Warm Temperate environments in deeper water (NHWT), open triangles: Southern Hemisphere Warm Temperate environment (SHWT), black squares: Cold Temperate environment (CT) and black diamonds: Antarctica (A). For each environment, the non linear model described in the methods is fitted.

