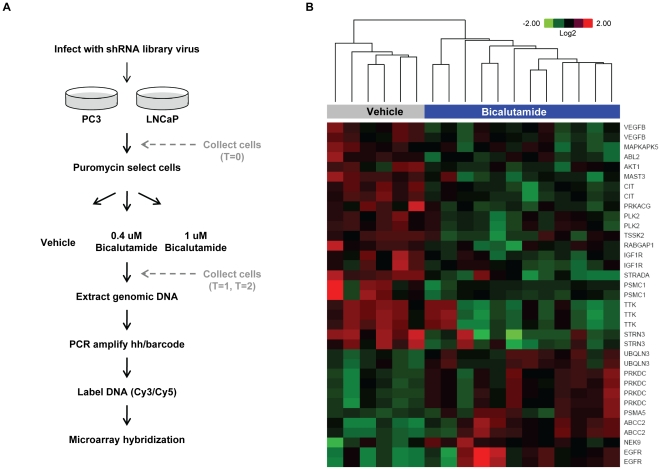
Figure 1. shRNA probes depleted or enriched in bicalutamide-treated LNCaP cells.
(A) Schematic of shRNA screen. Details can be found in the Materials and Methods section. (B) A heatmap was generated by clustering based on probes that were depleted or enriched (log2 bicalutamide/vehicle ≤+/−0.58 and a p-value≤0.01) in the bicalutamide (0.4 uM and 1.0 uM)-treated LNCaP cells at T = 1 and T = 2 compared to the vehicle-treated cells at the same timepoints. The shRNA target gene associated with each probe is indicated to the right of the heatmap. Target genes that appear more than one time on the heatmap indicate that more than one probe scored for that gene.

