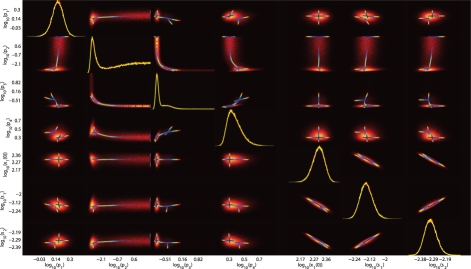
Fig. 3.
Histograms of the posterior distribution. Shown on the diagonal are the marginal (integrated) distributions of the parameters, where different colours indicate different batches of samples. Off the diagonal are the joint probability distributions between two parameters. The correlated nature of several parameters can clearly be observed. Lines indicate PL trajectories where blue and red corresponds to a good and bad fit, respectively. Note that the PL includes the prior on the scaling.

