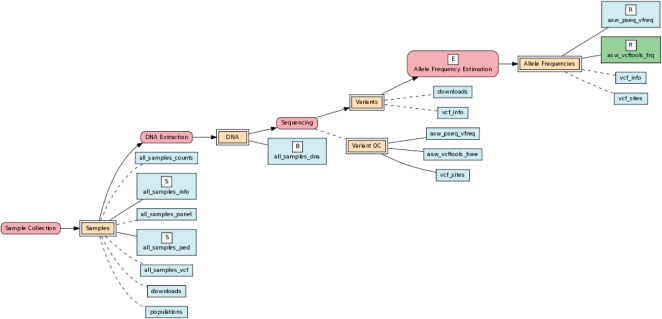
Fig. 1.
How the BERT model is used to trace experimental process flow back to the original samples and biologics for allele frequency estimates in the ASW population (African Americans in the Southwestern USA) from the October 2011 Release of the 1000 Genomes Project. The double rectangles represent groups of tables that may be input or output for the various processes and experiments (represented by ovals) in the database; these are referred to as flow groups. Processes that yield key experimental results in the database are designated as Experiments and labeled ‘E’. Tables in the database are represented by simple rectangles. Tables containing data on subjects, biologics and key experimental results are indicated by the labels ‘S’, ‘B’ and ‘R’, respectively. The goal is to trace the results back to subjects and biologics. Some groups and individual tables contain auxiliary reference data for processes and flow groups, respectively; reference nodes are indicated by dashed lines. See the Supplementary Materials for addition information on the BERT model.

