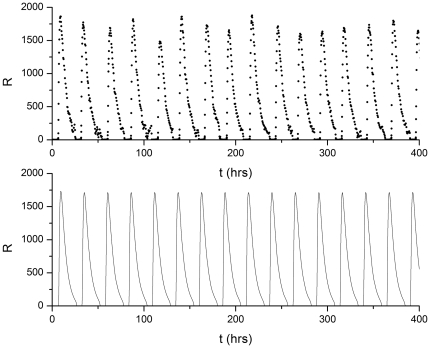
Figure 2. R protein number as a function of time (in hours).
Upper panel: R protein degradation rate  (and other parameters as described in the text) with the dynamics simulated using the stochastic algorithm (Gillespie model). Gene copy = 1. The corresponding rate equation model predicts perfectly periodic oscillations, as shown in the lower panel, for this set of parameters.

