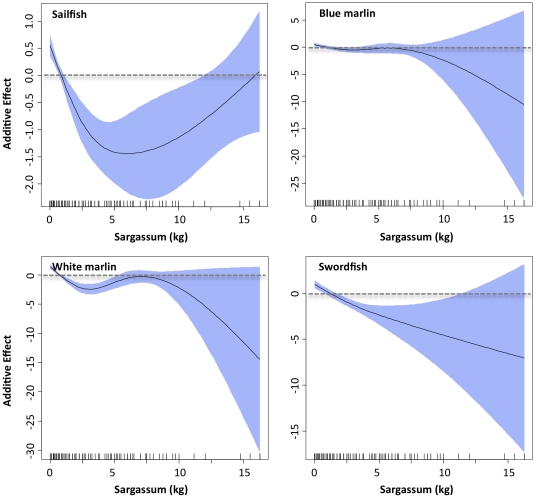
Figure 6. Response plots of biotic variable, Sargassum biomass, on the density of sailfish, blue marlin, white marlin, and swordfish larvae from final generalized additive models.
Solid lines denote smoothed values and shaded areas on each plot represent 95% confidence intervals. Dashed line at y = 0 displayed on each plot.

