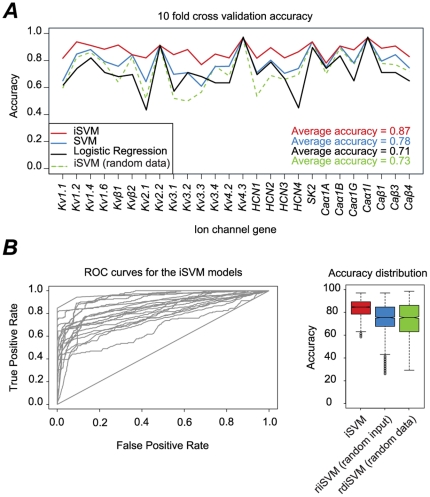
Figure 3. Models assessment and accuracy.
A 10-fold cross validation accuracies of the Logistic Regression (black), base SVM models (blue), and the iSVM models (red) of the twenty-six ion channel genes. B, left, Receiver Operating Characteristic (ROC) curves of the iSVM models for the twenty-six ion channel genes. B, right, boxplots of the 10-fold cross validation accuracies of the iSVM model (red), random inputs iSVM (riiSVM) (blue), and random data iSVM (rdiSVM) (green) after 1000 iterations.

