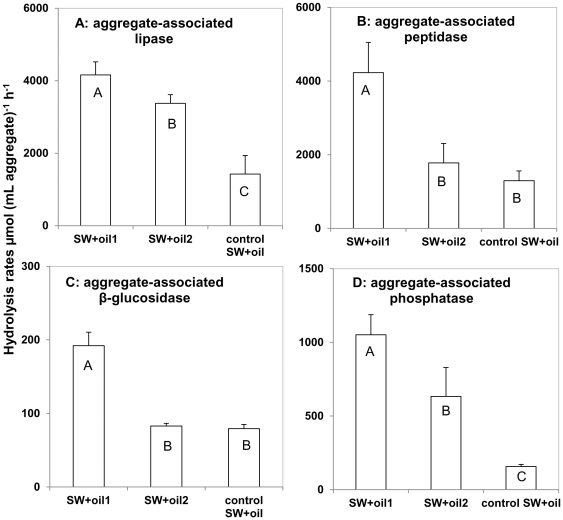
Figure 4. Aggregate-associated enzyme activities at the end of the incubation.
Average potential hydrolysis rates (n = 3 ± standard deviation) in oil aggregates after the 21-day roller table incubation. Letters indicate results from one-way ANOVA followed by the Bonferroni-Holmes test. Rates with the same letter are statistically indistinguishable. Note the different scales on the y-axis.

