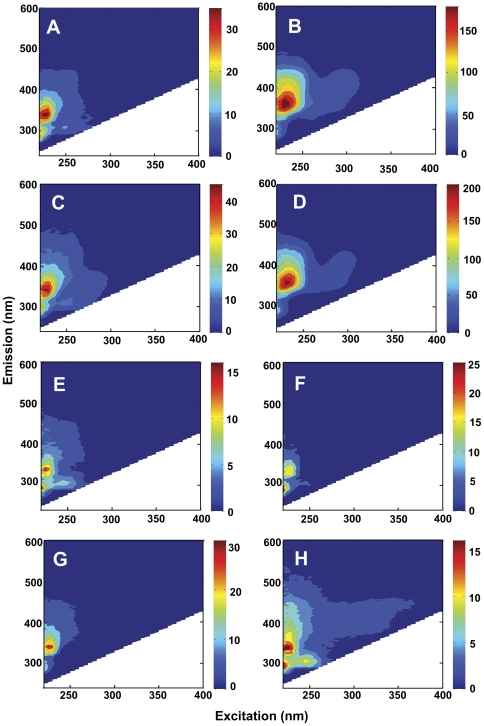
Figure 6. Excitation-emission matrices (EEMs) for day 0 and day 21; note difference in scale among panels.
(A) SW+oil2, day 0; (B) SW+oil2, day 21; (C) control SW+oil, day 0; (D) control SW+oil, day 21; (E) SW2, day 0; (F) SW2, day 21; (G) control SW, day 0; (H) control SW, day 16 (there are no data available for day 21). The fluorescence intensities in oil-amended bottles (panels B and D) at day 21 were one order of magnitude higher than for all other samples.

