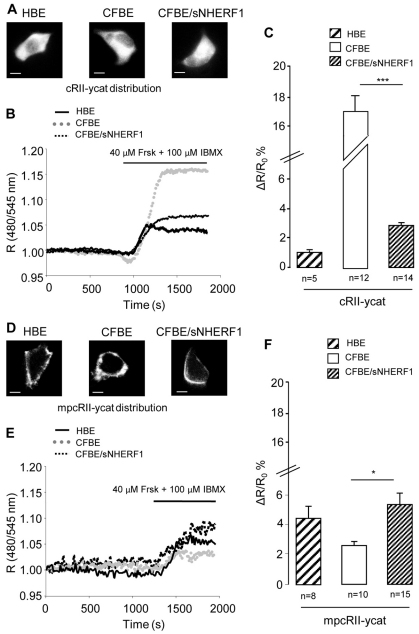
Fig. 5.
FRET analysis of cAMP response to Frsk and IBMX in HBE, CFBE and CFBE/sNHERF1. (A–C) Analysis of the cAMP sensor cRII-ycat. (D–F) Analysis of membrane-targeted mpcRII-ycat. Localization of cRII-ycat (A) and mpcRII-ycat (D) in the three cell lines (B,E) Representative kinetics of cAMP changes recorded in the cells shown in A and D, respectively. R is the normalized 480 nm/545 nm value calculated at each acquisition time point. Black line, dotted gray line and dotted black line represent kinetics recorded in HBE, CFBE and CFBE/sNHERF1 cells, respectively, both in the bulk cytosol and at the plasma membrane. (C,F) Summary of FRET changes measured in HBE, CFBE and CFBE/sNHERF1 cells expressing cRII-ycat and mpcRII-ycat probes, respectively, upon treatment with 40 μM Frsk and 100 μM IBMX. Data are means ± s.e. Scale bars: 10 μm. ***P<0.001; *P<0.05.

