
Figure 1.
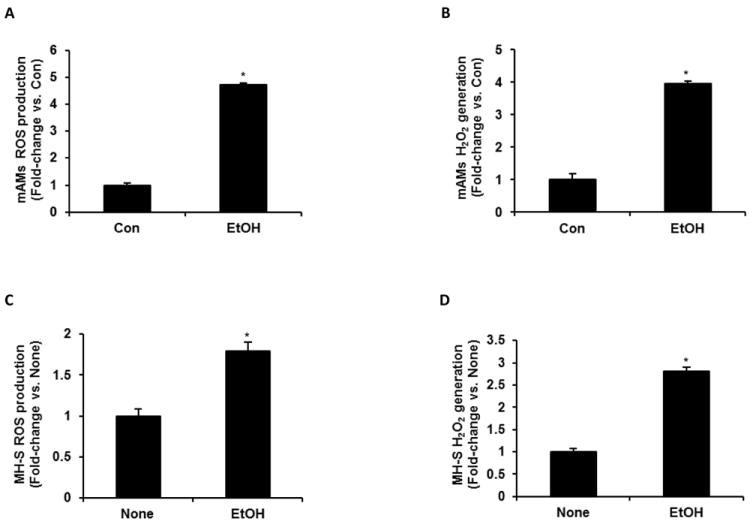
Ethanol induced ROS generation in mAMs. In mAMs collected from control (Con) and ethanol-fed (EtOH) mice (n=5, in duplicate), ROS production was measured by DCFH-DA fluorescence assay (A), and H2O2 generation was measured by Amplex Red assay (B). In cultured MH-S cells that were either untreated (None) or ethanol-treated (EtOH, 0.08%) for 3 days (n=3 independent experiments, in duplicate), ROS production (C) and H2O2 generation (D) were measured. H2O2 values were normalized to cellular protein concentration. All values are expressed as mean ± SEM, relative to control or no treatment. *p<0.05, EtOH vs. Con or None.