
Figure 5.
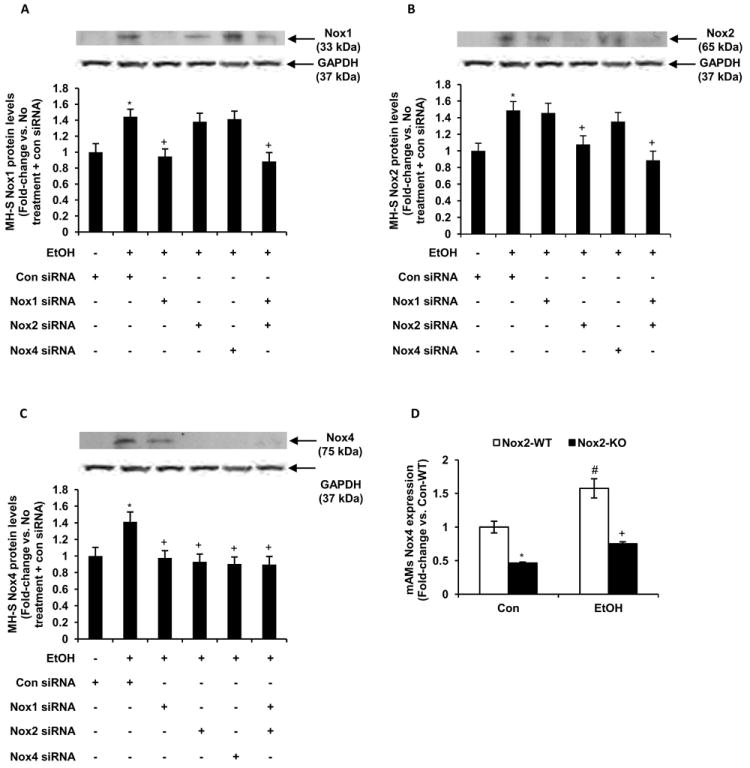
Ethanol induced Nox4 protein expression in vitro and in vivo via upregulation of Nox1 and Nox2. MH-S cells were transfected with control siRNA or siRNAs for Nox1, Nox2, Nox1+Nox2, or Nox4, and then cultured for 3 days with ethanol (EtOH, 0.08%) or without ethanol. Protein was isolated and protein levels of Nox1 (A), Nox2 (B) and Nox4 (C) were determined by Western blotting analysis and normalized to GAPDH protein levels (n=3 independent experiments). *p<0.05, EtOH vs. None; +p<0.05, EtOH+siRNA vs. EtOH. D, mAMs were collected from wildtype and Nox2 knockout mice that were either control-fed (Con) or ethanol-fed (EtOH). Expression of Nox4 was measured by computer analysis of confocal fluorescence microscopic images (n=5). Fluorescence values are expressed as mean relative fluorescent units (RFU) per cell ± SEM, relative to control. #p<0.05, Con-Nox2-KO vs. Con-Nox2-WT; *p<0.05, EtOH-Nox2-WT vs. Con-Nox2-WT; +p<0.05, EtOH+Nox2-KO vs. EtOH-Nox2-WT.