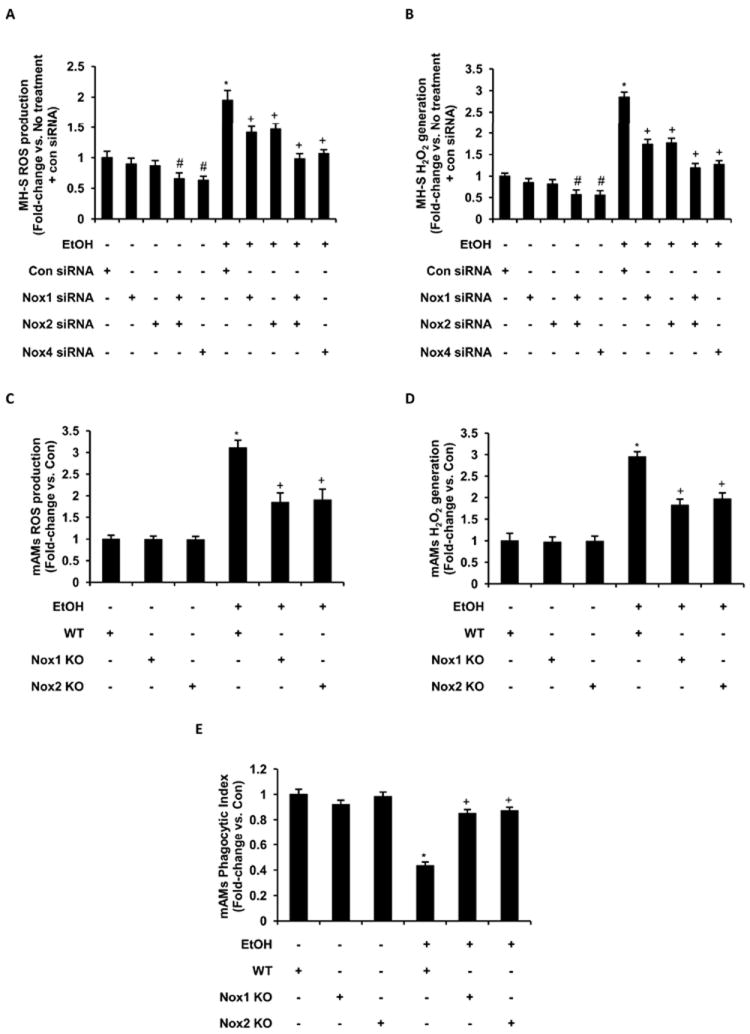
Figure 6.

Oxidative stress in ethanol exposed MH-S and mAM cells was regulated by Nox1, Nox2 and Nox4 expression. MH-S cells were transfected with control siRNA (20 nM and 35 nM) or siRNAs for Nox1 (20 nM), Nox2 (20 nM), Nox1+Nox2, or Nox4 (35 nM), and then cultured for 3 days with ethanol (EtOH) or without ethanol. Control siRNA concentrations were adjusted accordingly for comparison, combined, and presented as a single con siRNA value. A, Reactive oxygen species production in transfected MH-S cells was measured by DCFH-DA fluorescence assay (n=3 independent experiments, in duplicate). B, H2O2 generation in transfected MH-S cells was measured by Amplex Red assay (n=3 independent experiments, in duplicate). H2O2 generation values were normalized to protein concentration. mAMs were isolated from wildtype (WT), Nox1 knockout (Nox1 KO), and Nox2 knockout (Nox2 KO) and cultured for 3 days with ethanol (EtOH) or without ethanol (Con). C, Reactive oxygen species production in these mAMs was measured by DCFH-DA fluorescence assay (n=3 independent experiments, in duplicate). D, H2O2 generation in these mAMs was measured by Amplex Red assay and normalized to protein concentration (n=3 independent experiments, in duplicate). E, Phagocytic ability was assessed in these mAMs by phagocytosis assay (n=3 independent experiments, 10 fields per experimental condition). Phagocytic index was calculated from the percentage of phagocytic cells multiplied by the relative fluorescence units of S. aureus per cell. All values are expressed as mean ± SEM, relative to no treatment. #p<0.05, No treatment+siRNA vs. No treatment+Con siRNA; *p<0.05, EtOH+Con siRNA vs. No treatment+Con siRNA or WT+EtOH vs. WT+Con; +p<0.05, EtOH+siRNA vs. EtOH+Con siRNA or Nox1/Nox2 KO+EtOH vs. WT+EtOH.
