
Figure 7.
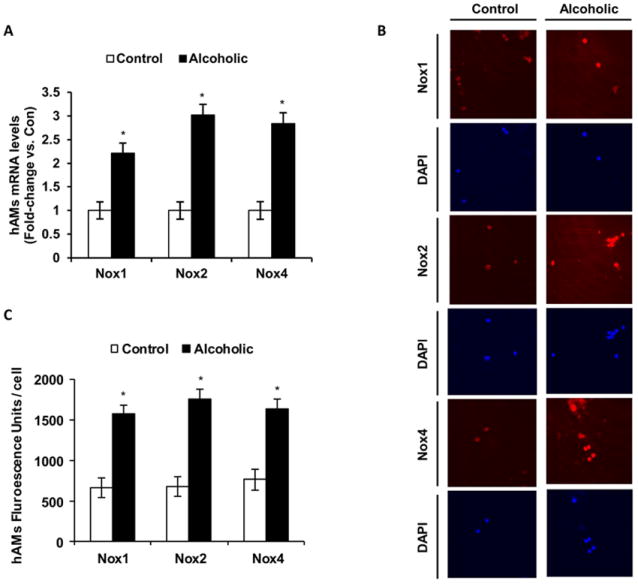
Ethanol enhanced Nox expression levels in hAMs. hAMs were collected from control (Control, n=5) and chronic alcoholic patients (Alcoholic, n=5). A, mRNA expression levels of Nox1, Nox2 and Nox4 were measured by qRT-PCR and normalized to 9s mRNA (n=10). B, Protein expression levels of Nox1, Nox2 and Nox4 were measured using computer analysis of confocal fluorescence microscopic images (n=10). C, Quantification of fluorescence images of Nox1, Nox2 and Nox4 protein levels. Fluorescence values are normalized to DAPI nuclear stain and are expressed as mean relative fluorescent units (RFU) per cell ± SEM. *p<0.05, Alcoholic vs. Control.