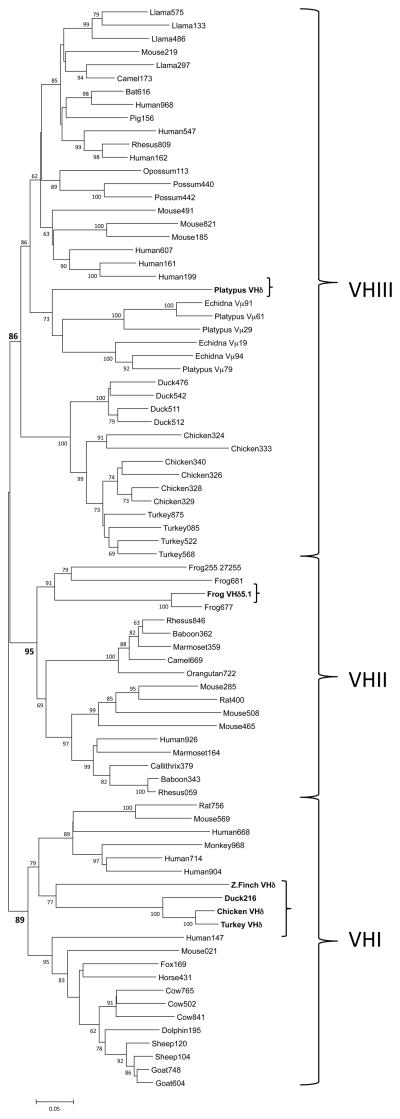
Figure 2.
Phylogenetic tree of the avian VHδ compared with VH genes from birds, mammals and amphibians. Avian VHδ genes are in bold and bracketed. The tree shown was generated using the Minimum evolution distance method. Similar results were achieved using Neighbor Joining. Bootstrap values are based on 1000 replicate samples. The last three digits of the accession number are indicated for those sequences taken from GenBank. The three VH clans are indicated with brackets on the right and their bootstrap support is shown in bold. A distance bar is shown below the tree.

