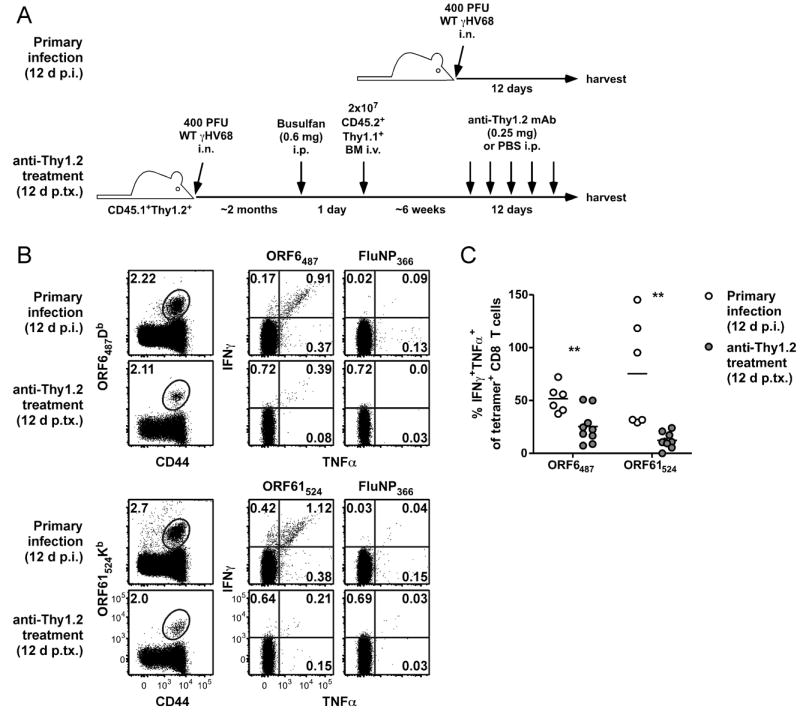
Figure 5.

Impaired antigen-driven cytokine production by reactivation-induced CD8 T cells. A, Experimental design. Spleens were harvested either from B6 mice 12 days after primary infection or from partial hematopoietic chimeras 12 days after the start of anti-Thy1.2 mAb treatment and analyzed by flow cytometry for tetramer-binding or intracellular cytokine production. B, Representative dot plots showing CD8 T cells from B6 mice or Thy1.1+ donor CD8 T cells from partial hematopoietic chimeras (left column) or cytokine production by CD8 T cell populations after 5 h stimulation with indicated peptides (middle and right columns). Numbers in plots indicate the percent of CD8 T cells (or donor CD8 T cells, where appropriate) that are in the given gate or quadrant. C, Percent of CD8 T cells (white circles) or Thy1.1+ donor CD8 T cells (grey circles) that are IFNγ+TNFα+ (double-positive) after stimulation with indicated peptides expressed as a percent of the CD8 T cells that were tetramer-positive for each condition, as determined in a separate stain of the sample (n=6-9/group, representative of at least 2 experiments; p.tx, post treatment; **P≤0.01; Student’s t test)
