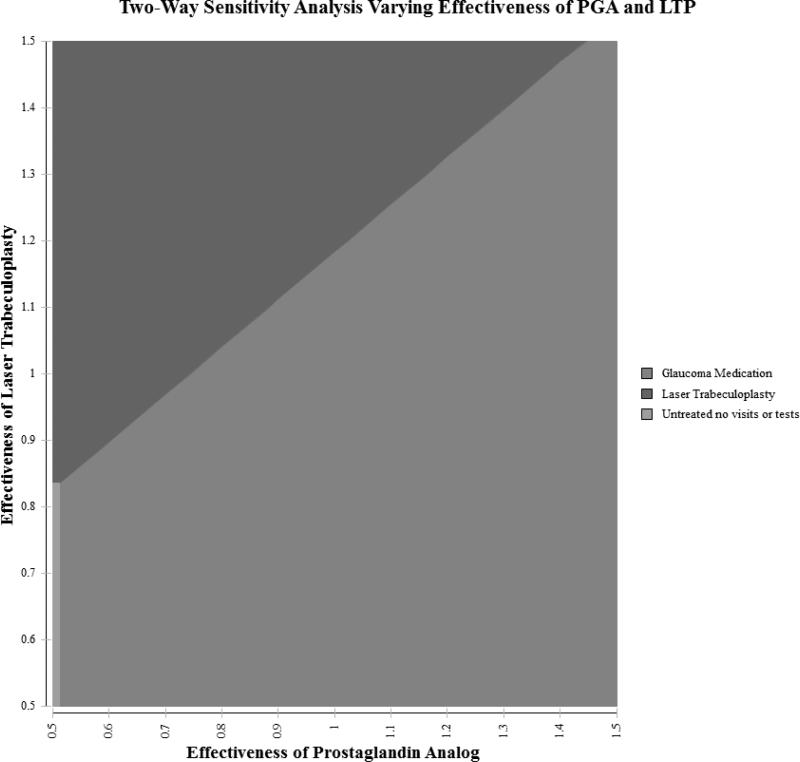
Figure 4. Two-way Sensitivity Analysis Simultaneously Varying Effectiveness of Medication and Laser in Base Model.
Figure shows the impact of simultaneously varying the effectiveness of PGAs and LTP on the results of the model. Each axis captures the relative effectiveness of each intervention at delaying glaucoma progression. A value of 1.0 means the base case effectiveness as outlined in the paper and higher values represent higher effectiveness and lower values represent lower effectiveness. For example, a value of 0.75 means a 25% reduction in effectiveness. Each colored region represents the preferred intervention assuming a willingness to pay of $100,000 per quality-adjusted life year.

