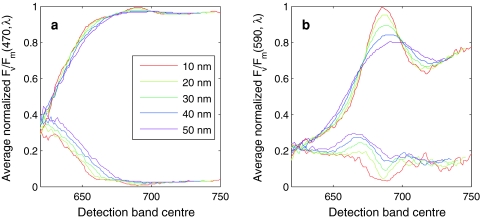
Fig. 11.
Dampening of observed F v/F m with changing emission band position and width. The plots show the average of F v/F m(λex,λem) measured in all a algal cultures, with λex = 470 nm, and b cyanobacterial cultures, with λex = 590 nm. Before averaging, F v/F m(λex,λem) emission spectra were normalized to their peak (found in the 680–690 nm emission region). Dashed lines indicate the standard deviation of the normalized F v/F m(λex,λem) emission spectra. All lines were smoothed over 5 nm. The sharply peaked F v/F m feature observed in all cyanobacteria cultures imposes strict limitations on the configuration of the emission slit

