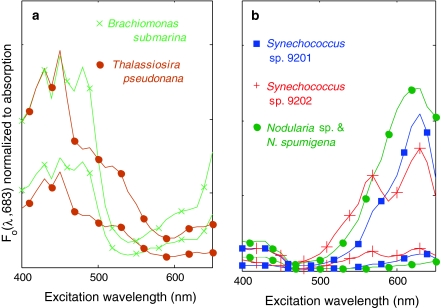
Fig. 2.
Diversity in fluorescence excitation spectra (F 0, emission 683 nm, spectra normalized to absorption as described under ‘Methods’) of the a algal and b cyanobacterial cultures used to simulate community fluorescence. Only the brightest and weakest fluorescing examples of each species are shown

