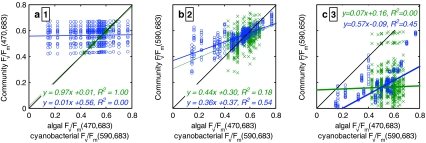
Fig. 8.
Case plots underlying the linear regression analyses of community F v/F m(λex,λem) versus algal and cyanobacterial F v/F m(470,683) and F v/F m(590,683), respectively. a–c correspond to the key excitation–emission pairs highlighted with numerical markers in Fig. 6. a F v/F m(470,683), sensitive to algal but not cyanobacterial F v/F m, b F v/F m(590,683), with stronger correspondence to cyanobacterial compared to algal F v/F m and c F v/F m(590,650), strongly related to cyanobacterial F v/F m(590,683) >0.4. Colours and symbols correspond to Fig. 7, drawn black lines mark unity. The discrete distribution of the subcommunity F v/F m values is caused by the limited number of cultures used to simulate community F v/F m matrices

