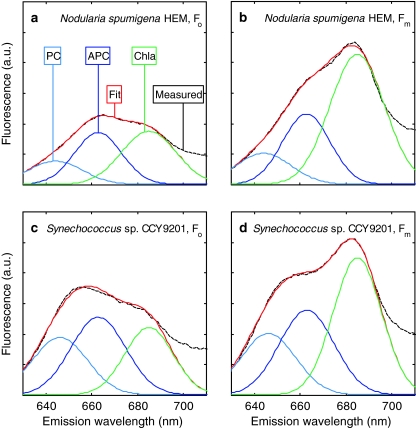
Fig. 9.
Fluorescence emission spectra at F 0 and F m of two cyanobacteria illustrating Gaussian band decomposition into the contributions of Chla and phycobilipigments (see text), and the occurrence of a variable component to the fluorescence attributed to phycobilipigments. a F 0(590,λ) of Nodularia spumigena HEM, b F m(590,λ) of N. spumigena HEM, c F 0(590,λ) of Synechococcus sp. CCY9201, d F m(590,λ) of Synechococcus sp. CCY9201

