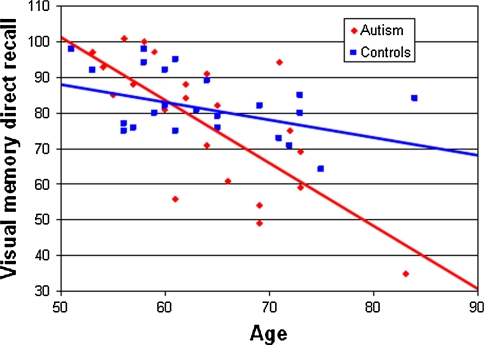
Fig. 3.
Relationship between age (x-axis) and performance on the visual memory task (direct recall; y-axis) for the autism group (red line) and the control group (blue line). This figure illustrates that age has a more pronounced effect in the autism group as compared to the control group (Color figure online)

