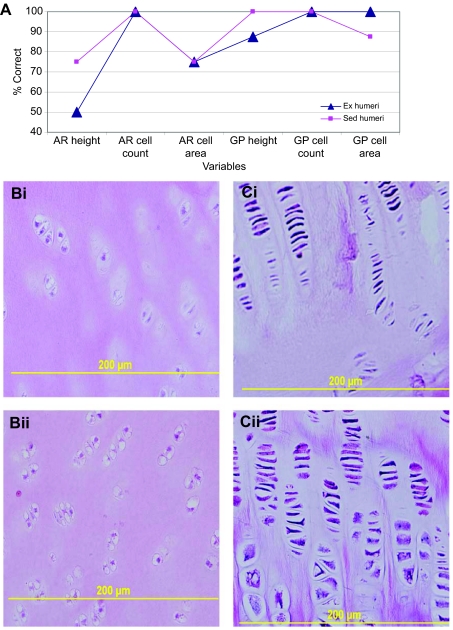
Fig. 3.
Ex and Sed humeri DFA results. (A) Line graph of the percentage correct for articular (AR) and physeal (GP) height, scaled cell count and cell area. Physeal values for peripheral and central regions have been averaged. (B) Examples of the articular cell counts for humeri from sedentary (Sed, i) and exercised (Ex, ii) pigs. (C) Examples of the physeal cell counts for Sed (i) and Ex (ii) humeri. The growth plate is oriented towards the top of the image.

