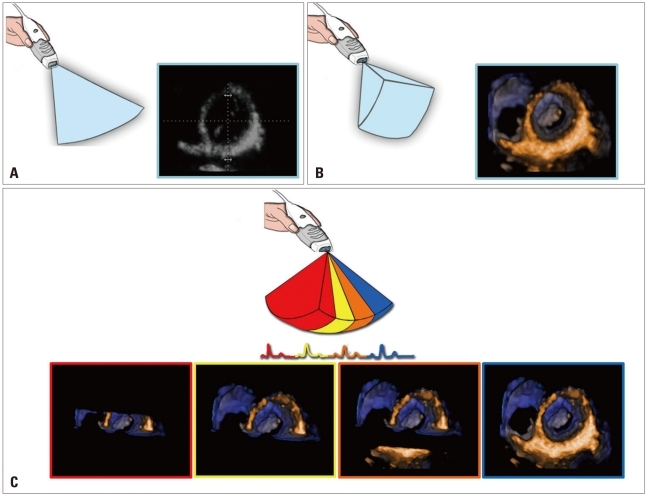
Fig. 2.
Schematic representation of two-dimensional (i.e. tomographic; A) and single-beat three-dimensional (i.e. volumetric; B) of the left ventricular short-axis at mitral valve level. Volumetric rendering displays many more details and allow better appreciation of spatial relationship among cardiac structures. C shows the multi-beat acquisition modality: two to six consecutive single-beat sub-volumes are stitched together to obtain a full-volume with higher spatial and temporal resolution.

