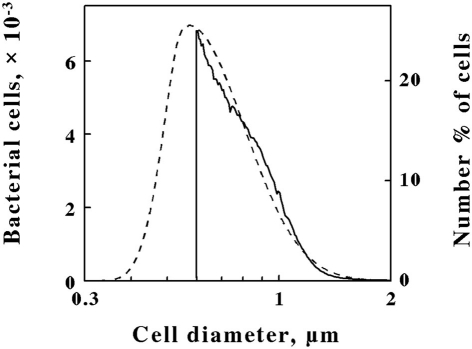
Figure 2.
Comparison of L. ferrooxidans cell populations by electrical impedance (solid line) and static light diffraction methods (dashed line). Electrical impedance measurements yielded absolute numbers of cells (left ordinate) as a function of size; light diffraction measurements yielded relative numbers of cells (right ordinate) as a function of size. The scale of each ordinate was chosen to facilitate comparison of the curves. The area under the electrical impedance curve was 81.2% of that under the light diffraction curve.

