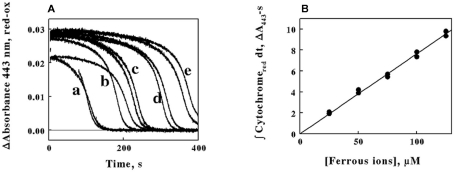
Figure 6.
The time integral of the absorbance of the reduced cytochrome in intact L. ferrooxidans correlates with the initial concentration of ferrous ions in the solution. (A) Time courses of the differences in the absorbance changes at 443 nm on the initial concentration of ferrous ions. Cells of L. ferrooxidans (2.1 × 10⁹) were introduced into sulfuric acid, pH 1.7, that contained 25, 50, 75, 100, and 125 μM ferrous sulfate in curves a through e, respectively; each curve was obtained in duplicate. (B) Dependence of the area swept out under the absorbance versus time curves in (A) on the initial concentrations of ferrous ions.

