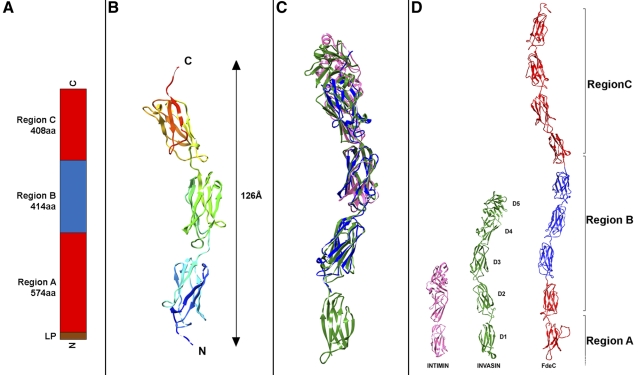
FIG 2 .
FdeC regions and crystal structure. (A) Schematic of the regional organization of FdeC. (B) Ribbon diagram of FdeCB (amino acids 678 to 991); N and C termini are indicated. (C) Superimposition of FdeCB, in blue, with intimin (PDB_ID 1F00), in purple, and invasin (PDB_ID 1CMV), in green. (D) Structural comparison between the crystal structures of the surface-exposed domains of intimin and invasin with a model of the potential surface-exposed region of FdeC. Modeled regions are colored in red, while the crystal structure of FdeCB is colored in blue.

