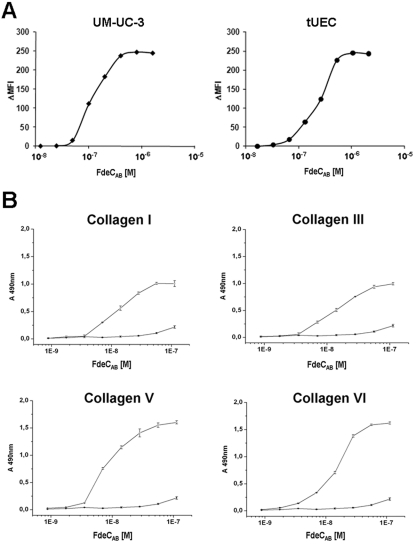
FIG 3 .
Binding of recombinant FdeC to epithelial cells and ECM. (A) UM-UC-3 and tUEC cells were incubated for 1 h at 4°C with increasing concentrations of recombinant FdeCAB. Binding of FdeCAB to cells was assessed by flow cytometry, and data are shown as mean fluorescence intensity (MFI) values plotted in the saturation curves. (B) Binding of increasing concentrations of FdeCAB to collagen I, III, V, and VI (open circles). BSA is used as a negative control (solid circles). Binding was quantified by ELISA. Points represent the means (error bars show standard errors of the means) of measurements made in triplicate.

