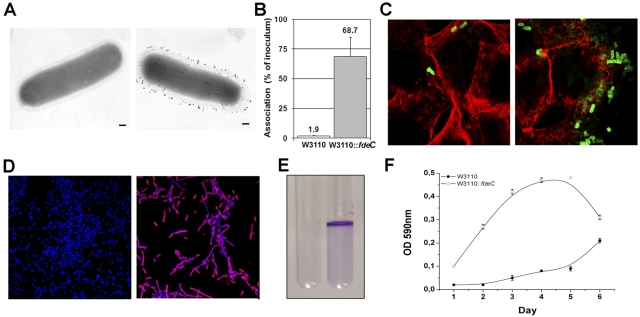
FIG 5 .
Constitutive surface exposure of FdeC in strain W3110::fdeC induces the formation of bacterial aggregates. (A) Immunogold transmission electron microscopy of FdeC surface localization in W3110 wild-type (left panel) and W3110::fdeC (right panel) strains. Fixed bacteria were incubated with an anti-FdeC serum and then with the secondary antibodies labeled with 10-nm gold particles. Bars, 200 nm. (B) Association rate of W3110 and W3110::fdeC with UM-UC-3 cells. The W3110 (white bar) and the W3110::fdeC (gray bar) strains were used to infect UM-UC-3 monolayers for 3 h at a multiplicity of infection of 10:1. Viable cell-associated bacteria were quantified after cell lysis. Results are expressed as a percentage of the inoculum. The data displayed illustrate the results of three independent experiments, including standard deviations. (C) Confocal microscopy analysis of UM-UC-3 cells infected with W3110 wild-type (left panel) and W3110::fdeC (right panel) strains. The W3110 strain and its derivative were detected using a polyclonal rabbit anti-E. coli K-12 antibody (green fluorescence). Actin was stained in red using phalloidin. (D) Confocal images of W3110 wild-type (left panel) and W3110::fdeC (right panel) strains adhering to glass slides reveal the propensity of the FdeC-expressing strain to form aggregates. Bacteria were localized with DAPI (blue), and FdeC was detected using the anti-FdeC serum and a fluorescent secondary antibody (red). (E) In vitro microcolony formation by W3110 (left) and W3110::fdeC (right) strains grown in LB medium at RT in polystyrene tubes. The macroscopic aggregates were visualized by crystal violet staining. (F) Kinetics of microcomplex formation at up to 6 days. Quantitative crystal violet staining was used to measure the level of the aggregation for W3110::fdeC in comparison with the W3110 wild-type strain. Data represent means and standard deviations of three independent measurements.

