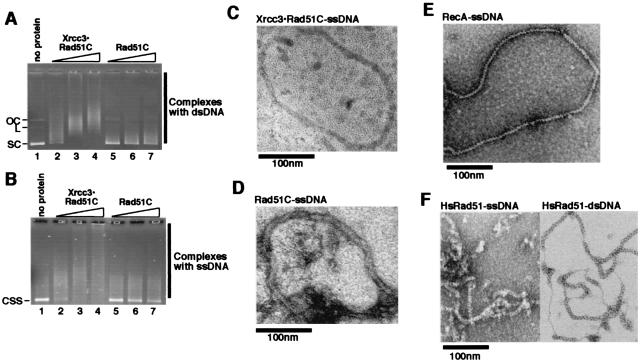
Figure 5.
DNA binding and electron microscopic visualizations of Xrcc3⋅Rad51C and Rad51C. (A) Superhelical dsDNA binding by Xrcc3⋅Rad51C and Rad51C. Superhelical dsDNA (10 μM) was incubated with Xrcc3⋅Rad51C or Rad51C at 37°C for 10 min, and the reactions were analyzed by 0.8% agarose gel electrophoresis in 0.5× TBE buffer. The concentrations of Xrcc3⋅Rad51C and Rad51C used in the DNA-binding experiments were 0.4 μM, 0.7 μM, and 1.0 μM. The concentration of Xrcc3⋅Rad51C was calculated as heterodimers. (B) Circular ssDNA binding by Xrcc3⋅Rad51C and Rad51C. Superhelical dsDNA (30 μM) was incubated with Xrcc3⋅Rad51C at 37°C for 10 min, and the reactions were analyzed by 0.8% agarose gel electrophoresis in 0.5× TBE buffer. The concentrations of Xrcc3⋅Rad51C and Rad51C used in the DNA-binding experiments were 0.4 μM, 0.7 μM, and 1.0 μM. The concentration of Xrcc3⋅Rad51C was calculated as heterodimers. (C) Electron microscopic visualization of Xrcc3⋅Rad51C complexed with ssDNA. The complexes were visualized by negative staining with uranyl acetate. (The magnification bar represents 100 nm.) (D) Electron microscopic visualization of Rad51C complexed with ssDNA. (E) Electron microscopic visualization of RecA complexed with ssDNA. (F) Electron microscopic visualization of HsRad51 complexed with ssDNA and dsDNA. (Left) HsRad51 complexed with ssDNA. (Right) HsRad51 complexed with dsDNA.

