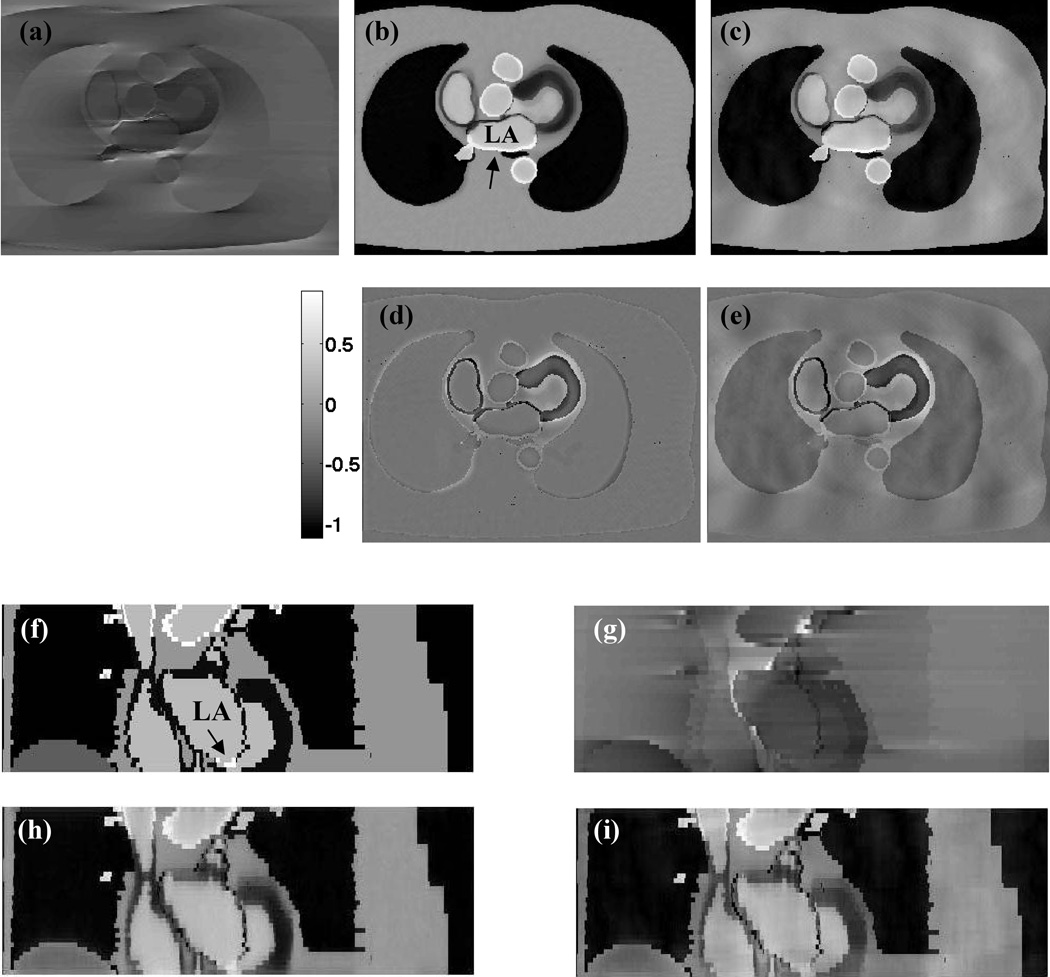
Figure 3.
Simulation results. (a) Compressed sensing reconstruction of kx-ky first scheme with 144 rays. (b) Corresponding reconstruction of a kz-first scheme with labeled left atrium (LA). Arrow points to enhanced signal region in the atrium after ablation. (c) Corresponding reconstruction from a Cartesian scheme. Cartesian image while superior to kx-ky first image has residual ghosting as compared to the kz-first image. (d, e) Difference images between the ideal image (Fig 1c) and Fig 3b and between the ideal image and Fig 3c respectively. Both the images are scaled the same to highlight differences. Peak difference in the images corresponds to 45% of the peak intensity in the ideal image. (f) Coronal cut of the ideal image with perfectly nulled myocardium (LA labeled). Arrow points to signal enhancement in the atrial tissue. (g–i) kx-ky-first, kz-first and Cartesian compressed sensing reconstructions.

