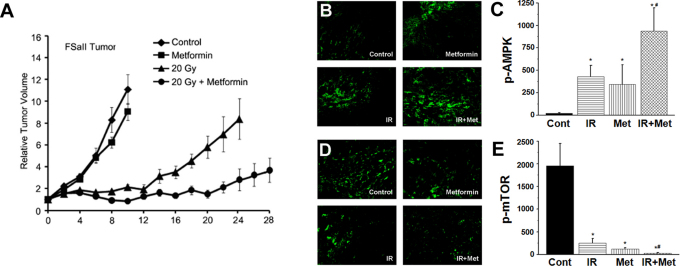
Figure 7. Growth and immunohistochemistry of FSaII tumors.
(A) Tumors grown (s.c.) to 150 mm3 in the hind legs of C3H mice were treated as follows. (a) Control. (b) Metformin: mice were injected i.p. twice a day with metformin at 25 mg/kg/dose from Day 0. (c) Tumors were irradiated with 20 Gy of X-rays in a single exposure. (d) 20 Gy + Metformin: Tumors were irradiated with 20 Gy of X-rays in a single exposure 1 h after the first metformin treatment. Data points are means of 7–10 tumors ± 1 S.E. (B–E) Immunohistological study for the expression of p-AMPK and p-mTOR in FSaII tumors. Tumors were treated with metformin and 20 Gy alone or combined as the tumors were treated for the tumor growth study (A), and tumors were excised on day 6. The cross-sections were stained and quantified for p-AMPK (B, C) and p-mTOR (D, E). All results are expressed as mean pixel counts per image ± standard error from 20 images derived from 3 tumors per group (magnification 200x). Representative images illustrating the average amount of staining are depicted in panels B and D for each treatment modality as indicated. *P < 0.001 treatment group vs. vehicle; #P < 0.05 metformin and radiation group vs. metformin alone.

