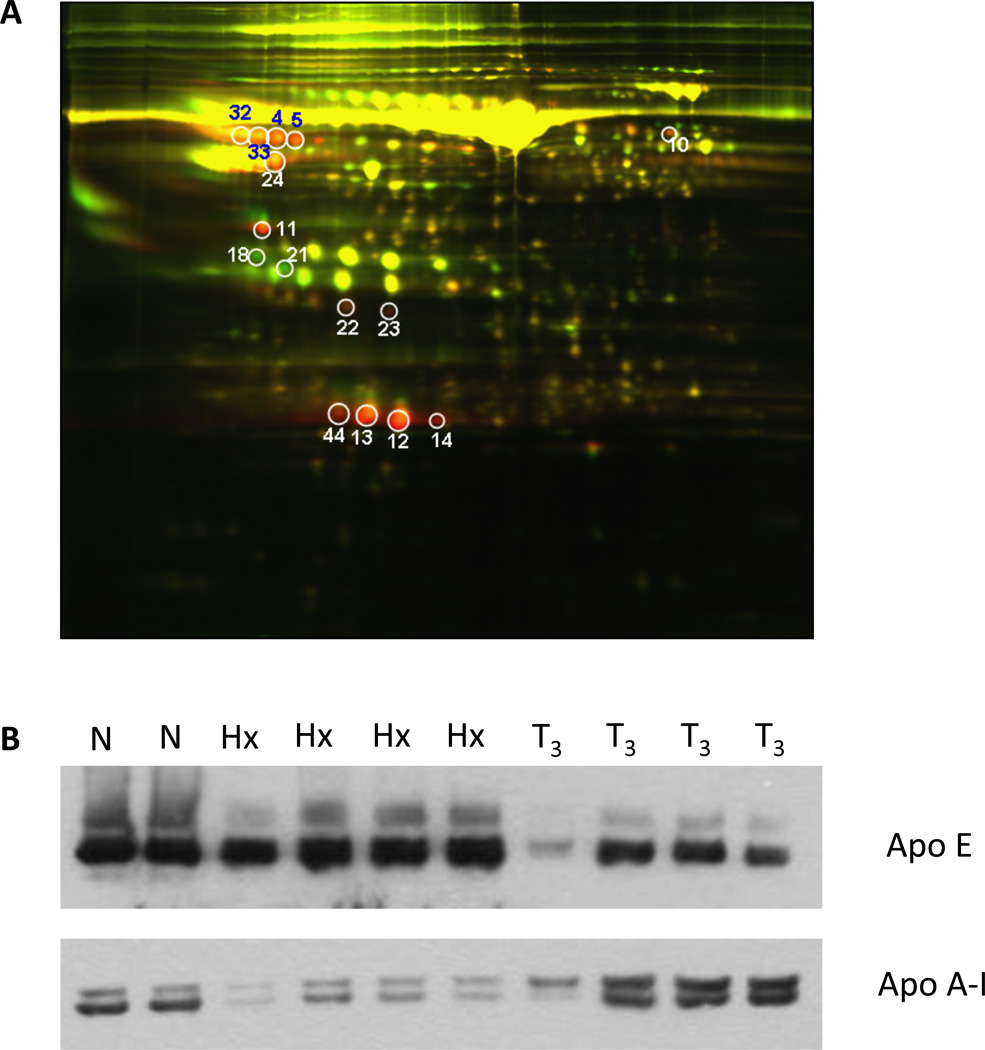
Figure 1.
A. 2D DIGE of Rat Serum. Serum was pooled from 3 hypophysectomized rats treated ± T3 and fluorescently labeled for analysis by 2D DIGE. This image shows gel analysis of pooled serum from Hx+T3 rats (red) overlayed with pooled serum from Hx rats (green). Red spots indicate proteins expressed in the Hx+T3 sera and green spots indicate proteins expressed in the Hx sera. Yellow spots are the result of similar protein expression in both conditions. The fold-change of differentially expressed proteins was quantified using ImageQuant software analysis. Proteins were then cut out, subjected to in-gel trypsin digestion, and identified by MALDI-TOF mass spectrometry. B. ApoA-I western blot analysis. Sera from the individual animals pooled for 2D DIGE analysis in Figure 1A was analyzed by western blot for ApoA-I and ApoE expression. Normal serum is shown as a control.

