
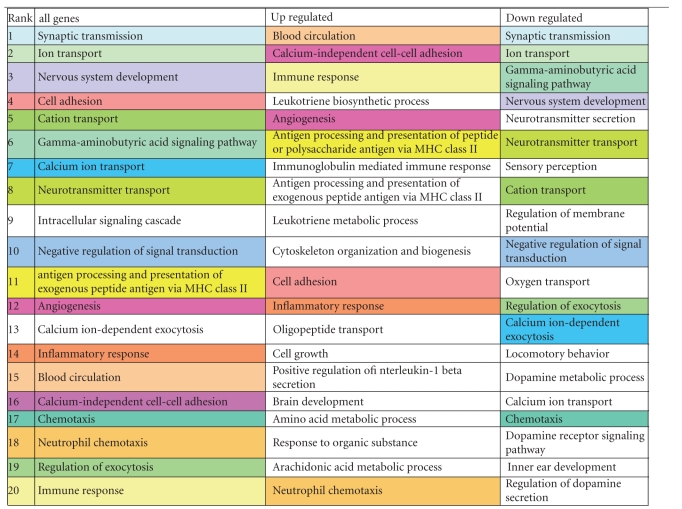
Table 2.
List of top 20 biological processes for all, up- and downregulated genes (P < 0.005).
|
Colours are respectively similar between all genes list to either up- or downregulated genes. Blue/green shades for downregulated; Red/yellow shadesfor upregulated.