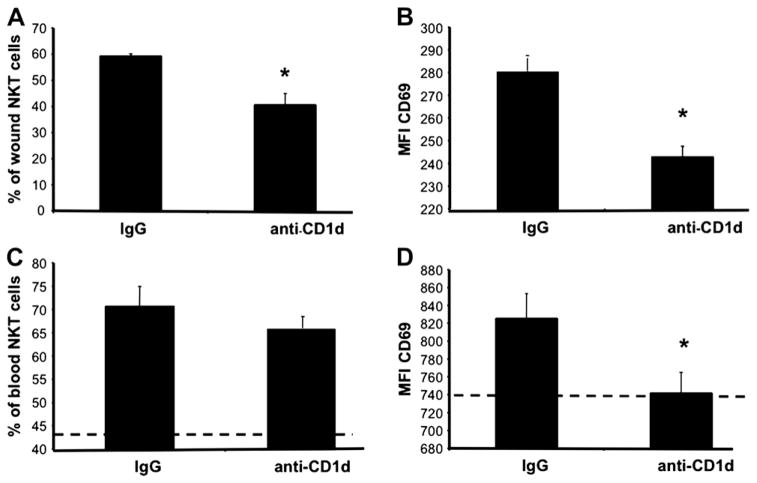
FIG. 8.
Day 1 wound and circulating NKT cell activation status in IgG versus anti-CD1d treated mice. Parallel groups of mice received either anti-CD1d mAb or control IgG (i.v.). Six hours later, all mice were given six 3 mm dorsal punch excisional wounds. One day post injury, wounds were excised, and wound cell suspensions were stained and analyzed by flow cytometry (A), (B). Blood was also collected from each animal. After red cell lysis, cells were stained and analyzed by flow cytometry (C), (D). Data is represented as the percentage of NKT cell population that is CD69+ (A), (C) and the mean fluorescence intensity (MFI) of CD69 (B), (D). The dashed lines (C), (D) represent the percentage of CD69+ circulating NKT cells (C), and the MFI of CD69 on circulating NKT cells (D) in uninjured animals; n = 4 mice per group. Similar results were obtained from two separate experiments. *P < 0.05.

