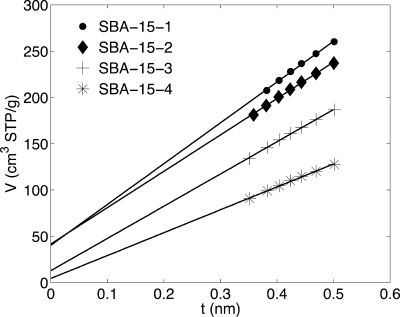
Figure 8.
Nitrogen t plot from 0.35 to 0.5 nm for calcined SBA-15-1 (●), acid-treated SBA-15-2 (⧫), SBA-15-3 with a grafted anchor (+), and SBA-15-4 with grafted PNIPAAM (*). At each step in the modification process, the intercept of the t plot is decreasing, reflecting the decrease in microporosity/intrawall porosity.

