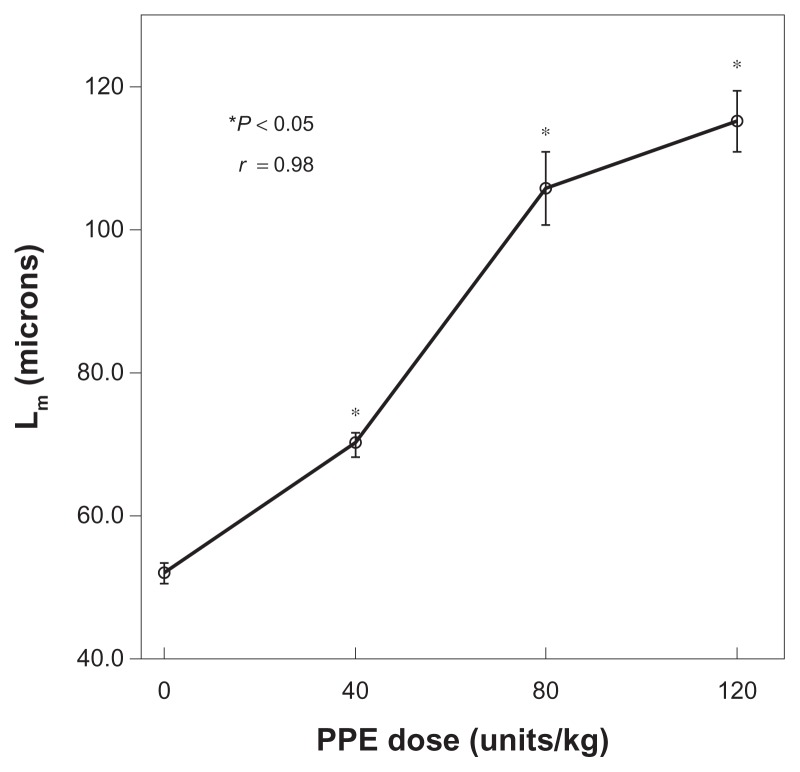
Figure 2.
Relationship between the mean linear intercept (Lm) and the dose of porcine pancreatic elastase (PPE). Lm increased when the PPE dose increased.
Notes: Error bars ± standard error of the mean (N = 4 or 5 for each dose). *Significantly different from control by analysis of variance (ANOVA) (P < 0.05). All groups were significantly different by ANOVA, except Lm of 80 U/kg was not different from an Lm of 120 U/kg (P = 0.11). Pearson’s correlation, R = 0.98. P value of the global test = 0.001 from the fitted ANOVA model.

